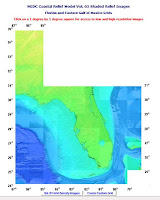
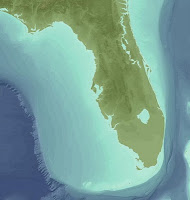
After doing a bit of research, I found a great source for integrated terrain and bathymetry at the NOAA coastal relief site. I found my area of interest, clicked on the link to download the data, and was somewhat surprised to see no obvious way to download the data--no 'download' button, no FTP link, nothing. I did notice a 'Create Custom Grid', but since I wanted all of the data shown in the map, that seemed like a hassle. So I called NOAA, and to my utter astonishment, reached an extremely helpful human being on my first attempt. She didn't know how to obtain the data either, but transferred me to someone who did.

Turns out, the ONLY way to obtain the data is by the 'Create Custom Grid' button, even if you want the whole enchilada. But it gets better--you can't specify the whole extent in the create custom grid dialogue, because the extractor limits your request to about 8,000 cells in either direction. So, I had to split the grid into fourths. Here are my notes outlining how to do that:

The grids are extracted and exported as ASCII text files, which I imported to ArcGIS GRIDs. But there's another catch: the upper value of each grid showed up as 65,535. This did not seem like a plausible elevation value (unless the Z values were in centimeters?!) so after a bit of Googling found this helpful post by Thomas Ballatore on the ESRI Support website. This is in response to someone working with SRTM data, but the same procedure worked equally well on the NOAA coastal relief data:
The SRTM files contain values from 0 to 65535. In a given SRTM tile, most of the values will be "typical" elevation values like the 1,133m and below you mention. However, areas where there is no data (voids) are assigned a value of 32768. The setnull command mentioned above would indeed set those values to "nodata".After running this on each of my four grids, I mosaiced them into a single grid, derived some hillshade, and was good to go.
HOWEVER, the SRTM data also correctly contains areas below sea level. These are reported as decreasing values from 65536. For example, an elevation of -2m would have a value of 65534, and elevation of -10 would be 65526 and so on.
For every country I have worked with that has a coastline, there will be a number of these along the coastline. Whether they are truly below sea level or if that is just an inaccuracy of the SRTM data would require further investigation.
Anyway, if you set all values greater than 1133 to nodata, then you will incorrectly set these negative values also to nodata. To avoid that, I use the following two steps in Raster Calculator to correctly prepare the SRTM data:
Step 1. Execute the following:
setnull([N30E119.bil] == 32768,[N30E119.bil])
where N30E119.bil is an SRTM file I was recently working with...change this to your tile's name. This will set the voids to nodata.
Step 2. Then execute this:
con([N30E119.bil] > 32768,[N30E119.bil] - 65536,[N30E119.bil])
This will correctly convert the negative values to negative values. Remember that spaces are important in raster calculator!

Once the Florida Resilient Habitats map is finalized and Sierra Club has signed off on it, I will post it here.
