Tuesday, September 16, 2014

Wilderness Act 50th Anniversary Map for The Wilderness Society

I completed this map at the end of May for The Wilderness Society. The map highlights 14 easily accessible hikes in the Wilderness Areas in the North Cascades. The reverse side features photos and a brief description of each hike, along with driving directions.


Friday, September 5, 2014

CORE GIS featured in NACIS Atlas of Design

We are extremely honored to have our map, Substrate of Puget Sound, included in the forthcoming NACIS Atlas of Design. The previous edition was full of innovative and inspiring cartographic compositions, and I'm sure this edition will be too. You can pre-order your very own copy here.


Thursday, May 29, 2014

Destination Darrington

Last week I was hired by a consortium of non-profits to make a map and brochure of recreation opportunities in Darrington, which has been economically devastated by the tragic slide in Oso. We went from initial concept to final product in less than six days!
Senator Murray has been promoting the Darrington area and the map is part of the larger effort to get tourists to visit this summer. There is a front-page story about it in the Everett Herald today,  And here is the newly created site where you can check out the map.

REI will be printing 20,000 (!) of these maps and distributing them for free from their stores throughout Washington.


Tuesday, March 11, 2014

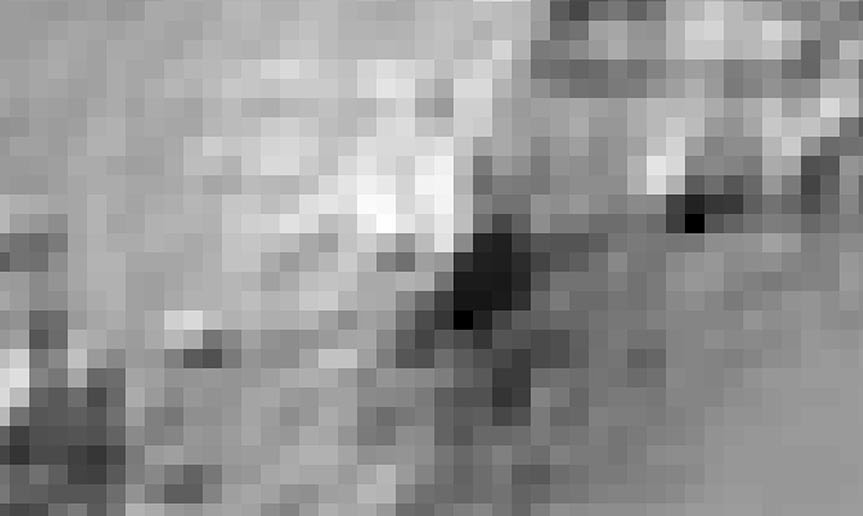
An Illustration of Raster Cell Resolution

I use a lot of raster data, both for cartography and analysis. Recently, I was asked to build a digital elevation model of the entire state of California at 10 meter resolution. This means the entire state is covered in square-shaped cells that are 10 meters on each side, and each cell contains a value for the elevation in its center. That works out to over four million pixels!

The resultant data layer was very, very large, so I asked the client if a coarser resolution would suffice, and I provided some examples. He said they really needed a hillshade of topography at 10 meters, and I found a way to make it work. After the data were delivered, I realized it made for a very nice illustration of how resolution affects the level of detail within raster data.

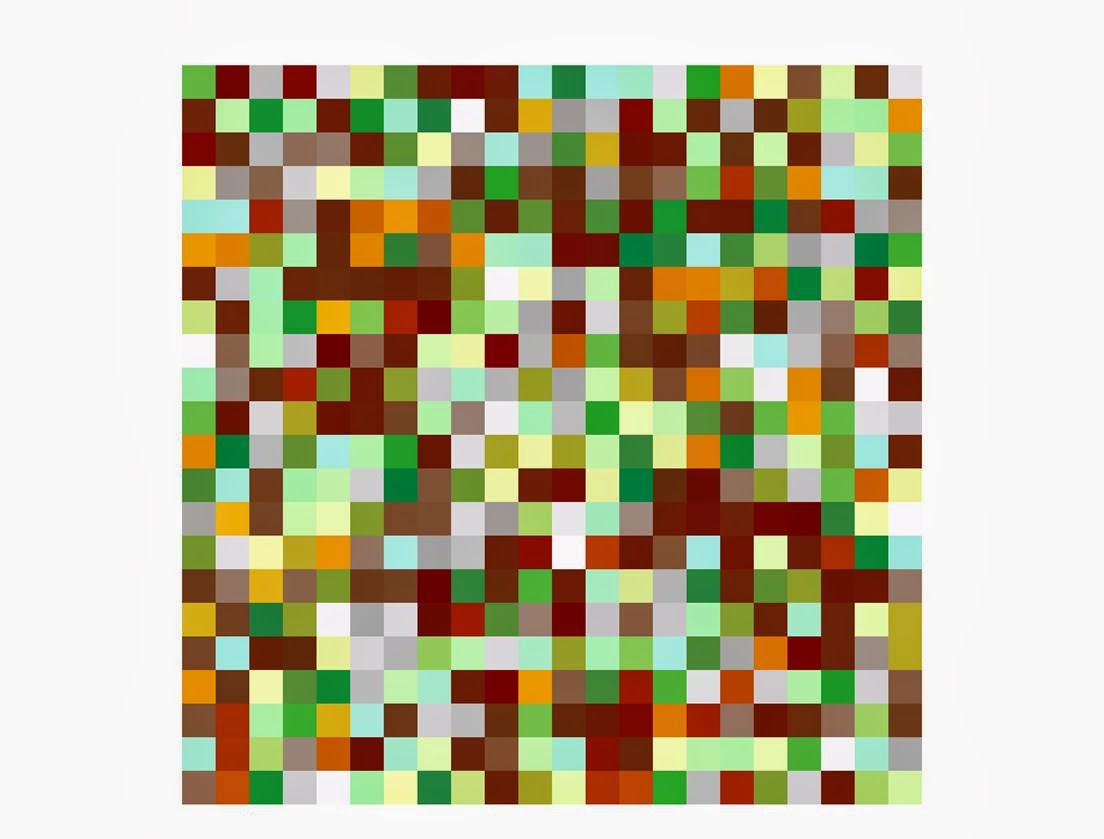
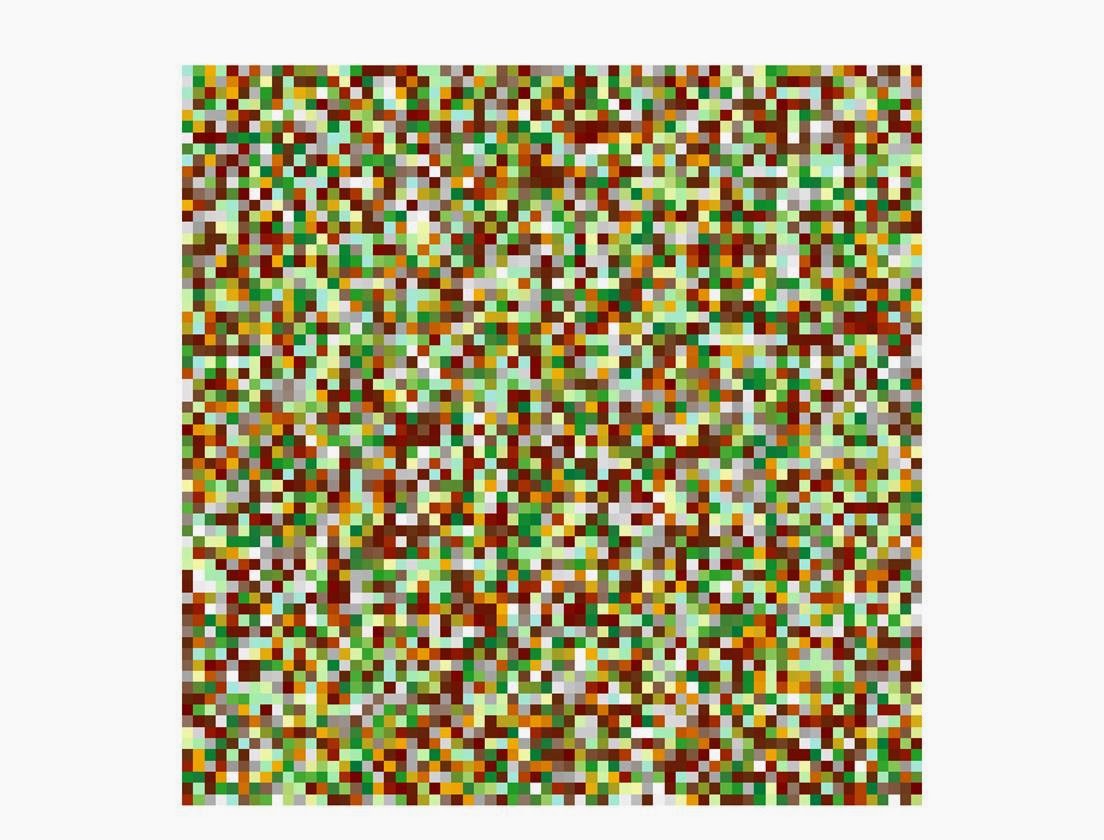
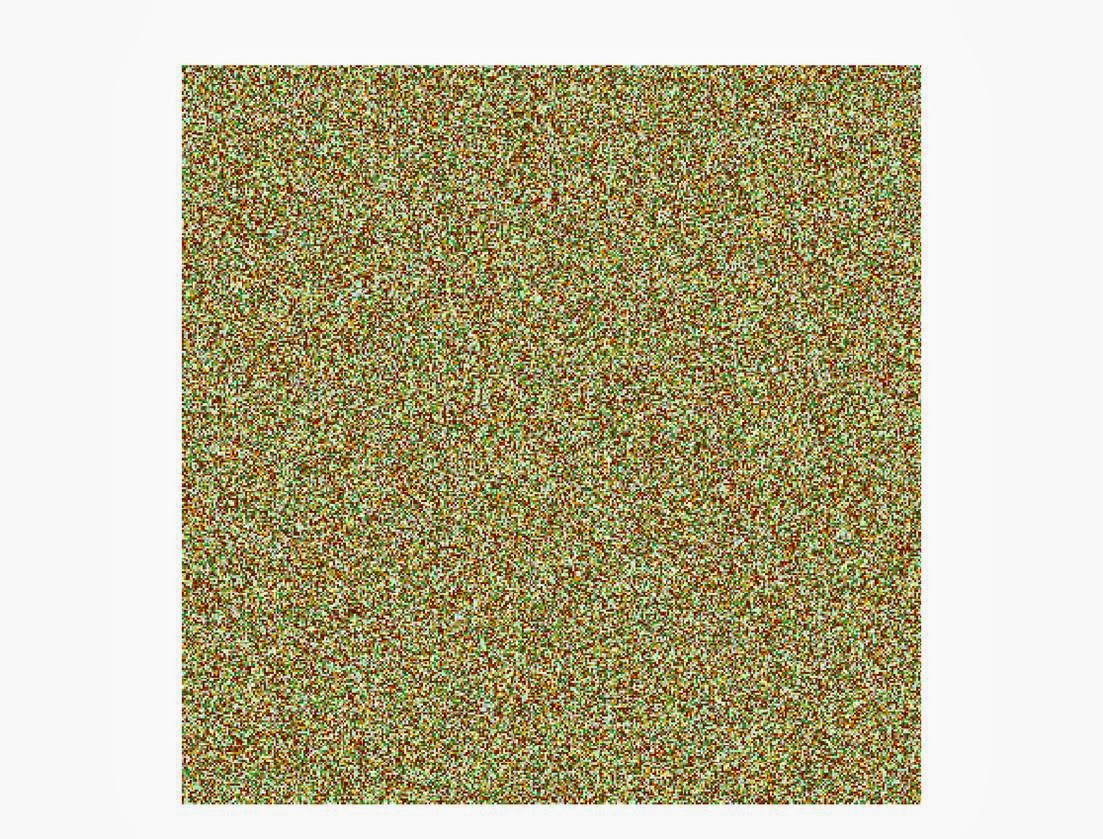
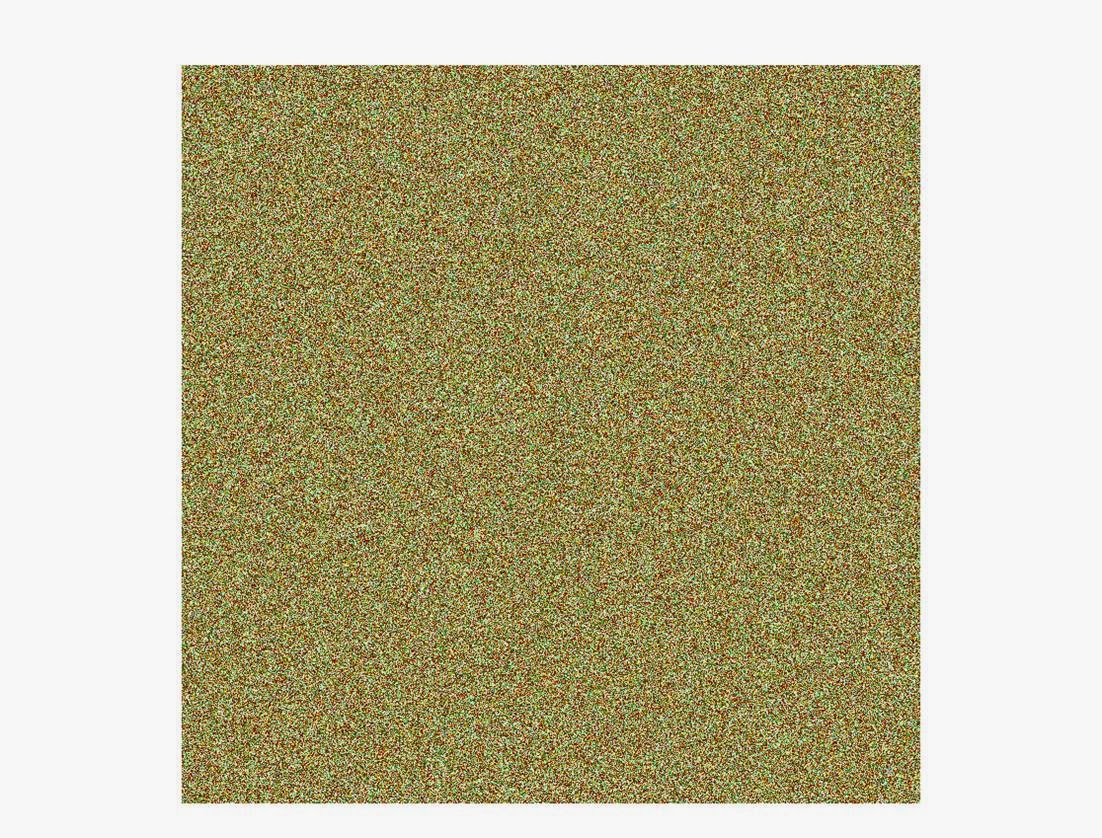
First, a series of hypothetical illustrations of resolution, with a real world example of a dataset at that resolution. The extent of the multi-colored images below is the same, the only thing changing is the resolution of the cells:

1000m (1 km)
4 cells
Forecasted changes to the distribution of birds in the Pacific Northwest, Global digital elevation models
90m
484 cells
Bathymetric data, SRTM, older satellite imagery
30m
4,356 cells
Most Landsat, some topographic data, much national scale landcover/vegetation
5m
160,000 cells
Regional Conservation Strategy data, some satellite imagery
1m
4,000,000 cells
NAIP imagery (same used for the Lark), LiDAR topographic data

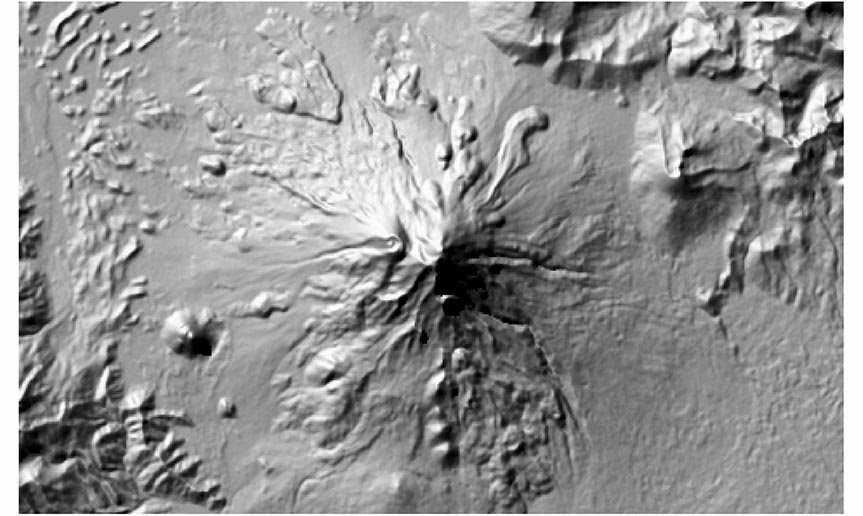
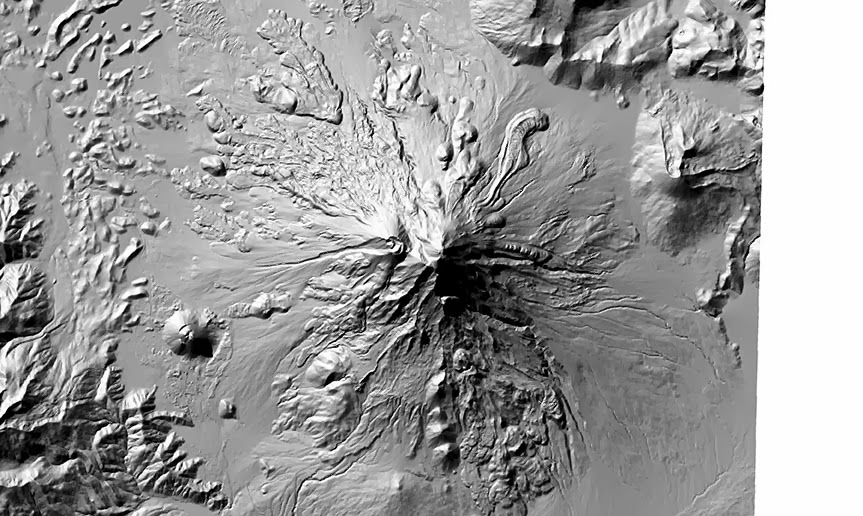
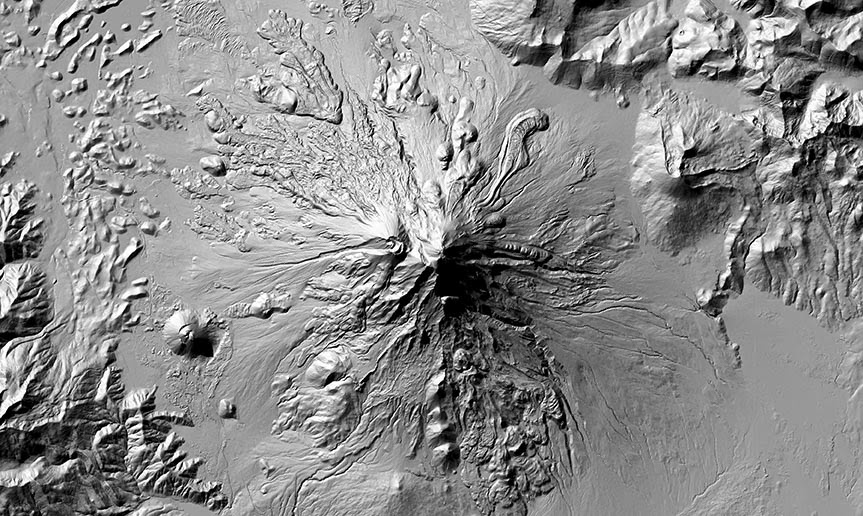
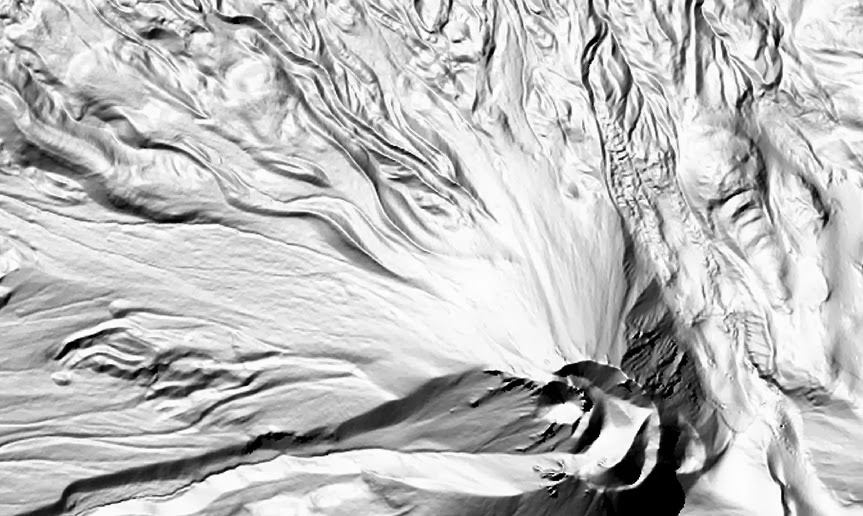
And now for a real-world illustration of resolution using digital elevation models for the area around Mt. Shasta in Northern California. Click images to embiggen:
1000m
The volcano is barely recognizable, unless you step way back from your monitor and blur your vision a bit

90m
Much better! Definitely looks like a volcano now. But still not too much detail.

30m
Now we're starting to see some real detail. Individual ridges and valleys are clearly discernible.

10m
Surprisingly, the 10m data doesn't look that much better, at least at this scale. So...

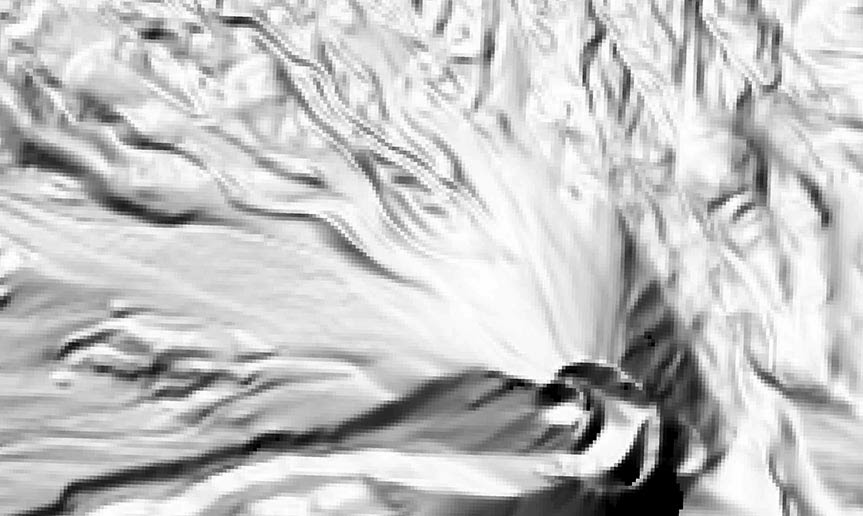
30m
If we zoom in to the caldera, we can see some details in the 30m data, but they aren't very crisp.

10m
This image shows the same area, but with the 10m data--it shows much, much more detail.

The bottom line is that more resolution isn't always better. The scale at which the data will be displayed or analyzed should always dictate the resolution of your raster data.


Tuesday, October 22, 2013

Mapping Belize

Last month my oldest son's teacher asked me to talk to her class about mapping, and in particular, how elevation above sea level is measured. I happily accepted and prepared a talk showing some of the mapping I've done over the years, and did my best to convey to a group of 5th and 4th graders how elevation is measured.

My extremely enthusiastic audience (teacher Susan is on the right)
How elevations were measured in the old days

How mean sea level is measured
At the end of the talk, the students asked if I would make a map for them. I promised I would and actually created two--one of the ecosystems of Belize and one showing elevation and topography.
 
Ecosystems of Belize. Click here for a full-res PDF.
Topography of Belize. Click here for a full-res PDF.

The elevation data is from a mosaic I created using Shuttle Radar Topography Mission data. There were numerous anomalies in the data, most of which I cleaned using focal windows, but it is not perfect. The majority of the base data came from the Biological Diversity in Belize website, including the ecosystems.

It was a fun mapping exercise and a great way to familiarize myself with our new (temporary) home!

Monday, September 9, 2013

CORE GIS Has Temporarily Relocated to Belize

My family and I moved to Ambergris Caye, Belize two weeks ago and we will return to Seattle in June 2014. I've relocated CORE GIS for the duration of our stay, and will continue working with all of our Washington and Oregon-based clients. I've ported the CORE GIS telephone number to Vonage (VoIP), and soon you will be able to call the same number and will not incur any international long distance charges. Email, Skype, and join.me will also be good ways to communicate and collaborate. Unfortunately my Seattle cell phone does not work in Belize, but if you need to get in touch right away you can reach me at +011-501-620-7249.

During daylight saving time, Belize is one hour ahead of Seattle, and during standard time, it is two hours ahead (same as US Central Time). Of course, meeting face-to-face will be a little more difficult, but I'm planning on one, possibly two trips back to Washington to meet with people, and will post those dates here once they are confirmed. Be sure to let me know if you'd like to get together.

And now for some photos of Belize!

The dock at the end of our street

Swimming in the Caribbean!

How our food (the produce, at least) gets to the island

John and Lewis, the fine fellows from Belize Telemedia Limited who connected us to the internet

Thursday, May 23, 2013

Where in the World?

Here is the map I made of the countries of origin for the students I spoke to last Friday.