Thursday, July 12, 2018

Mapping Seattle Population Density

The City of Seattle has grown tremendously over the past thirty years, and has added 114,000 residents just since 2010 (an increase of nearly 20%). This rapid population growth has resulted in a corresponding rapid increase in the cost of housing and the proliferation of construction projects to try to meet the demand. However, as a result of Seattle's zoning policies and Urban Villages strategy, this population growth (and the resulting changes to neighborhoods) has not been evenly distributed throughout the City.

We were asked by CAST Architects to model population density within the City of Seattle at three different time periods to get a better handle on where these changes are occurring. We mapped population density at the block level using US Census data for 1990  and 2010 and projected population in 2035 (taken from the City's Housing Affordability and Livability Mandatory Housing Affordability DEIS Alt 1).

Block groups are colored by density and displayed in three oblique views with the observer positioned southwest of the city, looking north/northeast. The maps show that the vast majority of the City's population growth has occurred in just a handful of neighborhoods--just 7% of the City's land area has absorbed 77% of all the growth!

Matt Hutchins at CAST continues to be a tireless advocate for increasing the construction of Detached Accessory Dwelling Units throughout the City, and used these maps in his presentation to YimbyTown to make the case that Seattle should expand housing options throughout the entire City, not just in the designated Urban Villages. 
Population density by block in 1990
Population density by block in 2010
Projected population density by block in 2035


Friday, June 8, 2018

Large Format Map Commission

One of my wife's colleagues lives on Whidbey Island. She loves taking visitors on trips around the island, and as a map aficionado, had long dreamed of having a custom map on her dining room table so she and her guests could look at the map before heading out to explore. When she learned that I make maps, we had a discussion about what she had in mind, and then she hired me to make a giant map! This was a real treat for me, since the vast majority of the maps I make are digital.

The finished map
Detail of the Clinton/Mukilteo ferry route at the southern end of the island

The printed and laminated map. Wife for scale.

The finished map, under the glass on the client's kitchen table

Friday, February 2, 2018

CORE GIS maps featured in Cascades Crossroads film

We had the privilege of working with the I-90 Wildlife Bridges Coalition to produce a series of maps that were featured in the recently released documentary Cascades Crossroads. We collaborated with filmaker Ted Grudowski illustrator/animator Lucy Woodworth. It was a fun project and I think the final product turned out great!


Cascade Crossroads from Ted Grudowski on Vimeo.


Friday, December 15, 2017

CORE GIS 2017 Holiday Card


I decided to go the old school route and created this years' holiday card by hand, with pen and ink and watercolor. Happy Holidays from CORE GIS!

Thursday, August 31, 2017

First Web Map with Carto!

I built my first interactive web map using Carto! (I normally use Mapbox or Leaflet). The Sightline Institute asked me to create an updated version of a map they made a few years back that shows the average price of Single Family and Multi-Family homes by neighborhood. When you zoom into a neighborhood, it shows the location and sale price of every individual transaction.

Click here to read the article, and click here to go directly to the map.

There was a significant amount of data prep to get the King County Assessor data working properly, but the results are pretty stunning, as demonstrated by this quote:

In fact, across the city multi-family home sales averaged $220,000, or 30 percent, less than average single-family home sales over the last year. Even brand new multi-family homes, those built within the last 18 months, cost an average of $45,000 less than older single-family homes, those built prior to 2016.

One of the biggest technical challenges for me on this project was figuring out how to incorporate Google Street View images into the pop-up. I solved it by generating lat/long coordinates for the centroid of each parcel, then I used my API key to call for the streetview photo that corresponds to that location.  


Friday, March 31, 2017

GIS Training in Nairobi Kenya

The GIS training workshop crew
For my third trip to Africa for the McKnight Foundation, I accompanied my friend and colleague Karsten Vennemann. Karsten was funded by the McKnight Foundation to provide GIS support to the Collaborative Crop Research Project (CCRP) for three years, and he hired me to assist.

The workshop was held at the African Institute for Capacity Development (AICAD) on the campus of the Jomo Kenyatta University of Agriculture and Technology. The institute covers all the bases--meeting rooms, lodging, and food. 
At the entrance gates to JKUAT
As with  my previous visits, we used open source GIS software exclusively, primarily QGIS. Unlike previous visits, this workshop was a full week and focused only on GIS--it was not tacked on to a previously scheduled research methods workshop.

The attendees came from a variety of government agencies, NGOs, and Universities. We had several students in the workshop as well, and they seemed to show the keenest interest and definitely learned the fastest!
Working on QGIS and R
Karsten and I divided the teaching duties roughly equally, and tried to give the students a balance of instruction and hands-on exercises. Unfortunately Karsten got really sick the night before our day long session on R (the open source statistical analysis package). I did my best to improvise a session using other materials, but it was difficult without Karsten! Fortunately he recovered by Friday and was able to cover some of the R material in the morning.

After teaching all day, I would make a bee line for my room, change out of my formal teaching clothes and into shorts and a t-shirt, grab my camera and binoculars, and head for the fields. JKUAT is located outside of Nairobi, and has extensive agricultural fields and the associated ponds, hedgerows, etc, all of which make excellent bird habitat.

On these daily 'bird walks' I would always see a variety of birds, but I would also meet students and locals who were just cutting through the fields. They all thought I was a bit crazy, but they were very friendly and several groups of people asked me to take their picture. I'm not entirely sure why, but I was happy to oblige.

White-winged widowbird
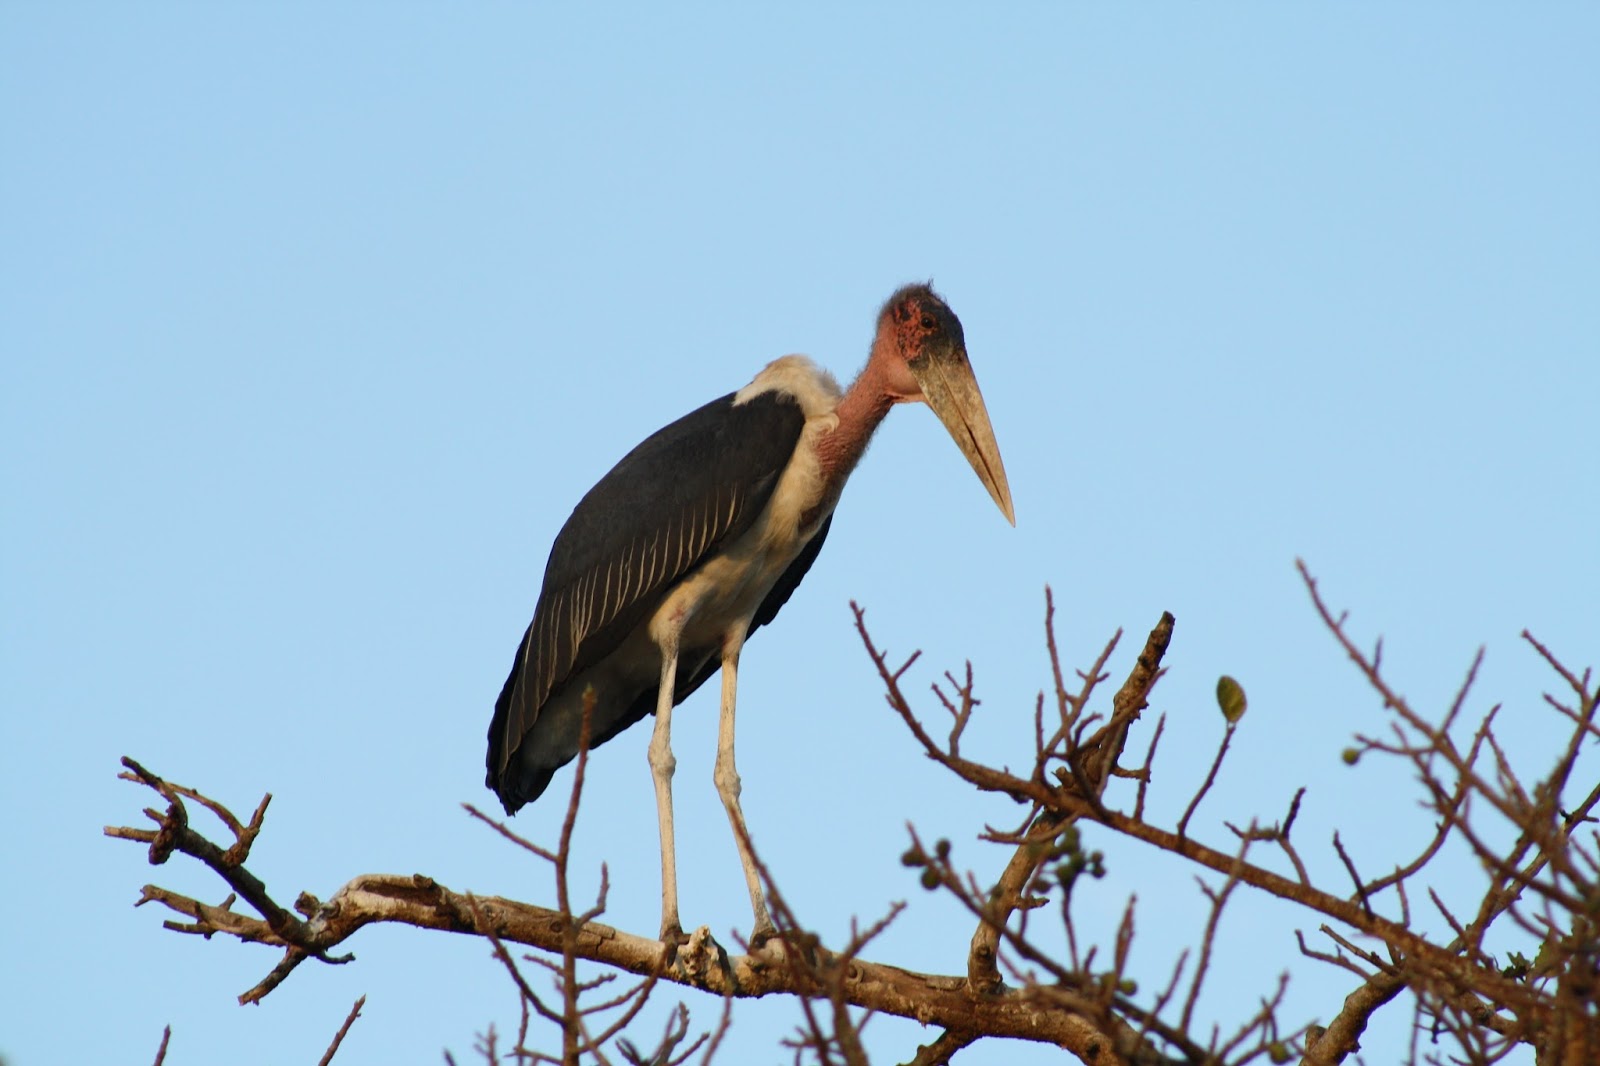
Marabou stork
Some of the friendly locals I met on one of my bird walks, they even gave me a mango!
Long-tailed mouse bird

After the workshop Karsten and I headed south from Nairobi to Amboseli National Park for a quick safari before heading back to Seattle. This was my third time to Africa for the McKnight project, and on the previous two trips there was little to no time to see the amazing wildlife and landscapes just outside of the cities hosting the workshops. Since Nairobi is surrounded by incredible national parks and reserves, Karsten and I were determined to at least take a couple of days to visit one of the nearby parks. After doing a bit of research, we were able to find a guide who would pick us up at JKUAT, drive us to Amboseli National Park, and act as our safari guide within the park as well.

We had a very early departure on the first morning and an uneventful (but long) drive south, nearly to the border with Tanzania. We had a good view of the brand new Chinese-built and Chinese-funded railroad  connecting Nairobi and Mobassa. We stayed in a (very posh) tent at the Kibo Safari Camp, just outside the entrance to Amboseli National Park.


The scenery and wildlife within and around Amboseli is truly stunning. I've never seen anything like it, and it is hard to describe the feeling of being surrounded by wild elephants, giraffes, hippos, hyenas, lions, antelope, and more bird species than I could possibly identify. So I'll let the pictures tell the story.

Our tent at Kibo

Me and Karsten on top of Observation Hill with Amboseli NP in the background
Thomson's gazelles

Hippos!

Zebra

Ostrich

Black-bellied bustard

Bull elephant

Crested cranes, symbol of Uganda

Hyena

Saddle-billed stork, straight out of a Richard Scarry book

Giraffe!

African fish-eagle, the bird I most wanted to see in Kenya!
Elephants in front of Mt. Kilimanjaro. This is one my favorite photos I took on our safari. Still can't believe I was really there!

Friday, October 28, 2016

CORE GIS 10 Year Anniversary Celebration!

CORE GIS is ten years old! On Thursday, October 27 we held a joint celebration of this milestone with our friend and colleague Karsten Vennemann of Terra GIS. We both started our consultancies back in 2006 and have collaborated on and off over the years on a wide variety of projects.

We were joined by clients, family, friends, and our fellow GIS professionals at the Bergschrund in Ballard, the tasting room for the Northwest Peaks Brewery.  It was the perfect size, the beer was tasty, and it provided the perfect setting for reflecting on ten years of mapping, analysis, and collaboration.

Here's to the next ten years!

Some of the old CommEn Space crew--Christopher, Gene, Karsten, and Matt

The extended CommEn Space family--Gene, Christopher, Karsten, Matt, and Matt


Here is a gallery of some of the maps we've created and people we've worked with over the last ten years. Enjoy!
Ten Years of Mapping at CORE GIS